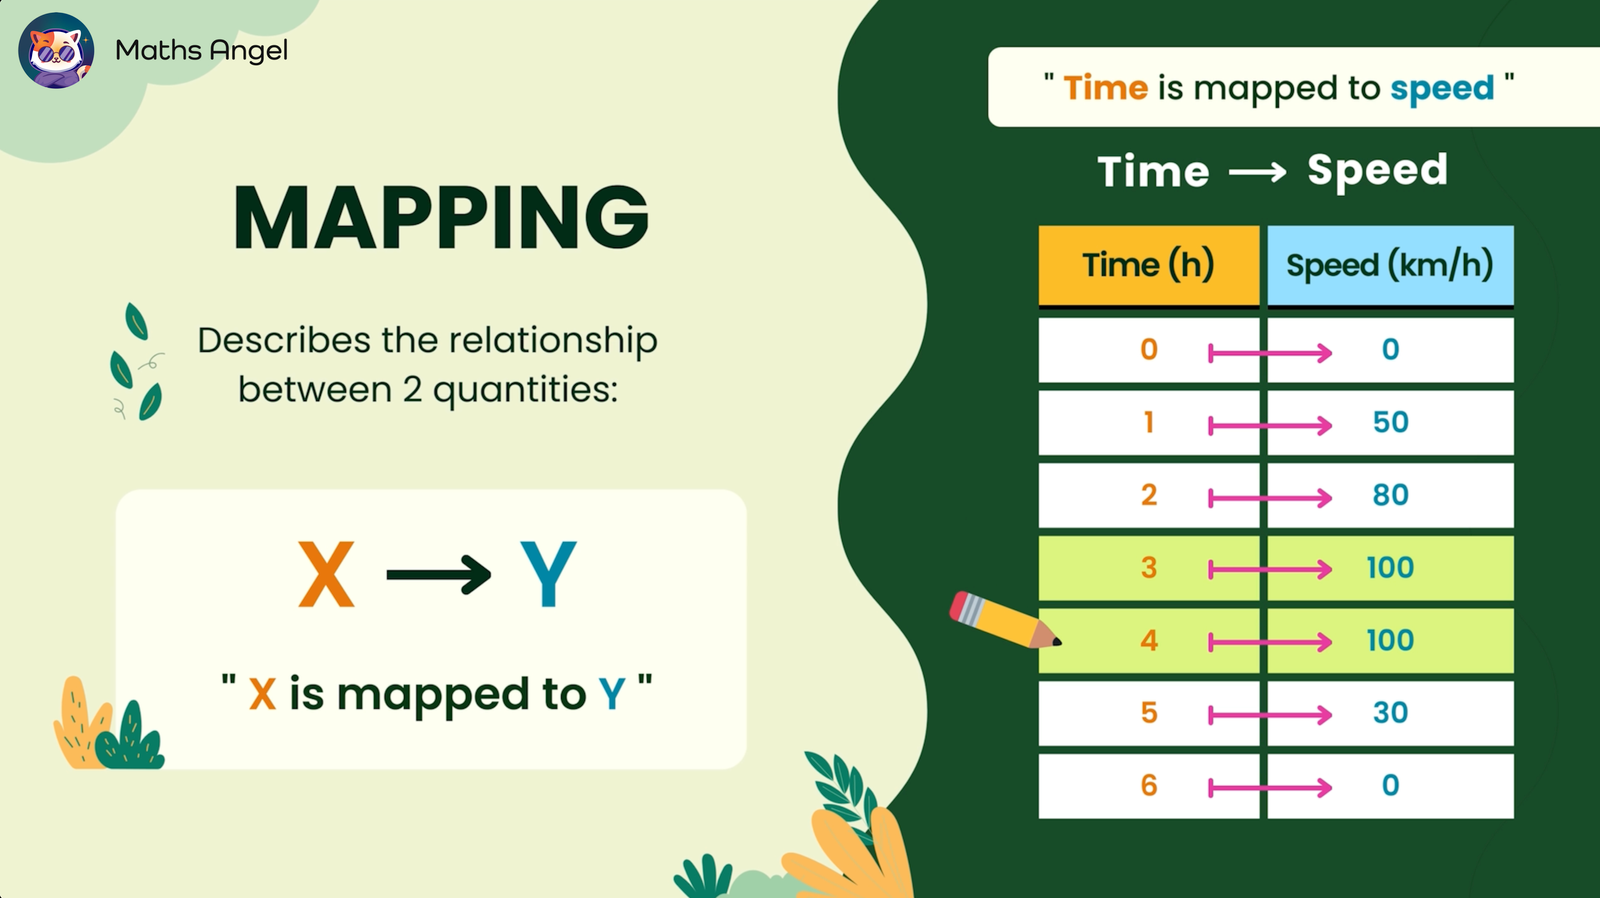
Introduction to Mapping

🎬 Video Tutorial

  • (0:01) Mapping Definition in Math: Mapping shows the relationship between two quantities, where each input (e.g., time) has a corresponding output (e.g., speed).
  • (1:10) Using Tables and Graphs for Mapping: Tables provide exact values for each pairing, while graphs allow easy visualisation of trends, such as changes in speed over time.
  • (1:55) When to Connect Points on Graphs?: Points are connected to show continuous changes, like speed over time, but remain separate for distinct categories, like types of balls and their weights.

πŸ“‚ Revision Cards

πŸͺ Quiz Time - Practice Now!

0%

Introduction to Mappings

1 / 6

Q: If the time (hours) is mapped to speed (km/h), which is the input quantity?

2 / 6

Q: Which of the following is an example of a mapping?

3 / 6

Q: Which of the following should not be represented by a connected line on a graph?

4 / 6

Q: After 3 hours of driving, the car’s speed was 100 km/h. What does this mean in mapping terms?

5 / 6

Q: The graph of a car's speed shows a flat horizontal line between the 3rd and 5th hours. What does this mean?

A line graph titled "Car's Speed Over Time," showing speed (km/h) on the y-axis and time (hours) on the x-axis.

6 / 6

Q: A table shows hours and speeds. Which statement is true?

Your score is

The average score is 49%

0%

🎩 AI Math Solver (ChatCat)

Need math help? Chat with our AI Math Solver at the bottom right!

0 0 votes
Article Rating
guest
0 Comments
Newest
Oldest Most Voted
Inline Feedbacks
View all comments

Leave a Comment

Your email address will not be published. Required fields are marked *