Tally Marks, Bar Charts, Tables
Table Of Contents
🎬 Math Angel Video: Understanding Tally Marks
What is a Tally Mark Chart?
⏩️
🛎️ Definition of a Tally Mark Chart:
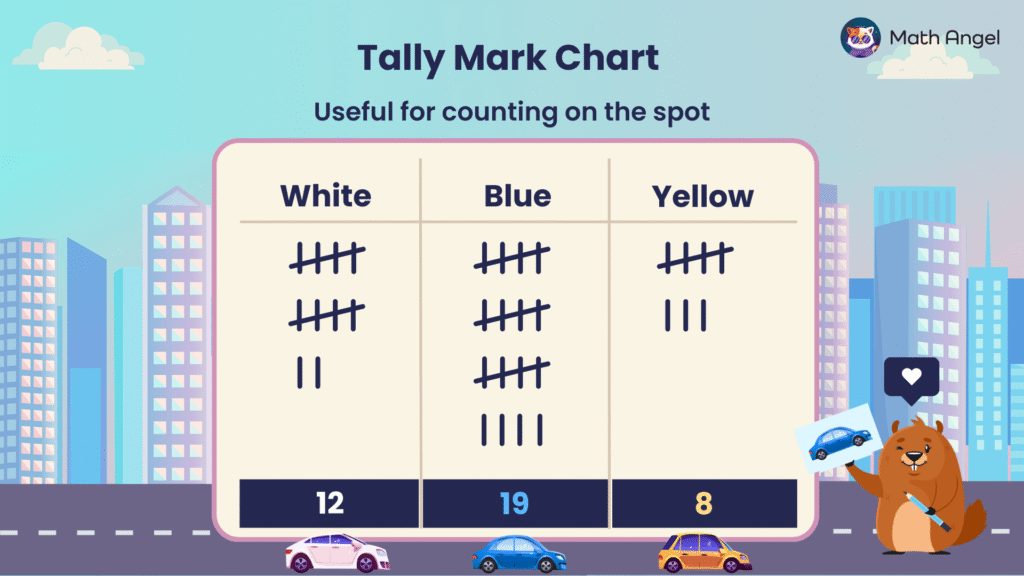
A Tally Mark Chart is a quick way to record and count data on the spot using tally marks.
Each tally mark represents one count, and every fifth mark is drawn as a diagonal line across the previous four to form a group of five.
🛎️ Example: How to Read a Tally Chart?
- White Cars: Two full groups of 5 + 2 extra marks → 12
- Blue Cars: Three full groups of 5 + 4 extra marks → 19
- Yellow Cars: One full group of 5 + 3 extra marks → 8
Tally charts are especially useful in surveys, counting objects, and organizing real-time data efficiently.
What is a Bar Chart?
⏩️
🛎️ Definition of a Bar Chart:
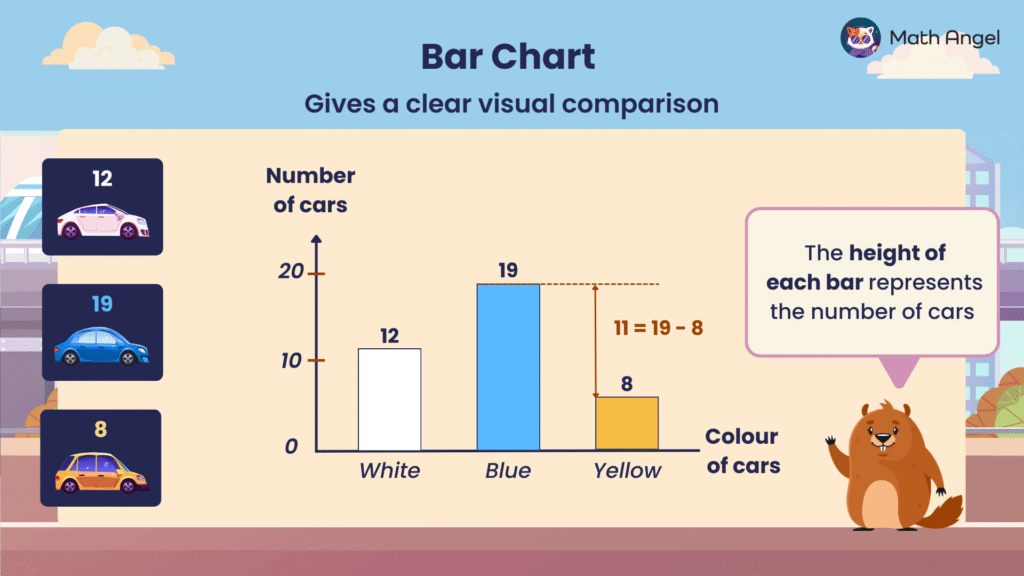
A Bar Chart is a graph used to compare different categories using rectangular bars. The height of each bar represents the value of the category being measured.
🛎️ Example: How to Read a Bar Chart?
- Categories on the X-axis: In this chart, the X-axis represents the colors of cars (White, Blue, Yellow).
- Values on the Y-axis: In this chart, the Y-axis represents the number of cars counted.
- Bar Heights Represent Values: The taller the bar, the greater the number.
- White Cars: 12 (Bar height reaches 12 on the Y-axis)
- Blue Cars: 19 (Tallest bar, reaches 19)
- Yellow Cars: 8 (Shortest bar, reaches 8)
🛎️ Insights From the Bar Chart:
- The difference between blue and yellow cars is 11, shown as 19 – 8 = 11.
- The blue bar is the highest, meaning blue cars were the most common.
Bar charts are commonly used in comparisons and trend analysis to make data easier to understand visually.
What is a Table in Math?
⏩️
🛎️ Definition of a Table:
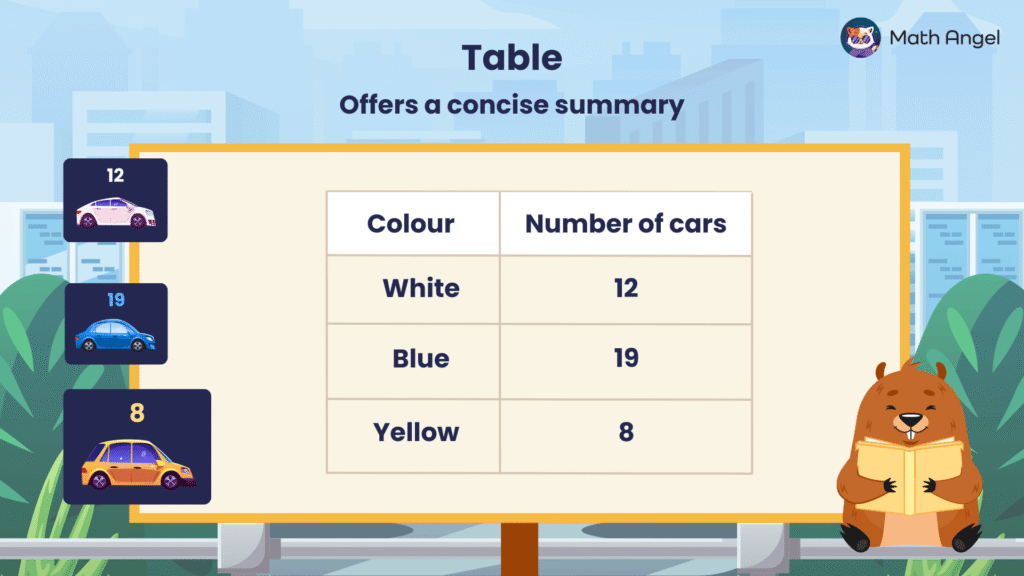
A table is a way of organizing data into rows and columns for a clear and structured summary. Tables help compare values quickly without needing calculations or visual interpretation.
🛎 Example: How to Read a Table?
- Column Headers: Each column has a title that explains what it represents. In this table:
- 1st column (“Colour”) lists the categories (White, Blue, Yellow).
- 2nd column (“Number of Cars”) shows the count for each color.
- Rows Represent Data Entries: Each row contains a piece of information.
- 12 white cars were counted.
- 19 blue cars were counted (highest number).
- 8 yellow cars were counted (lowest number).
Tables are commonly used in data analysis, statistics, and reports to structure and summarize information clearly and efficiently.
Comparison: Tally Marks vs. Tables vs. Bar Charts
⏩️
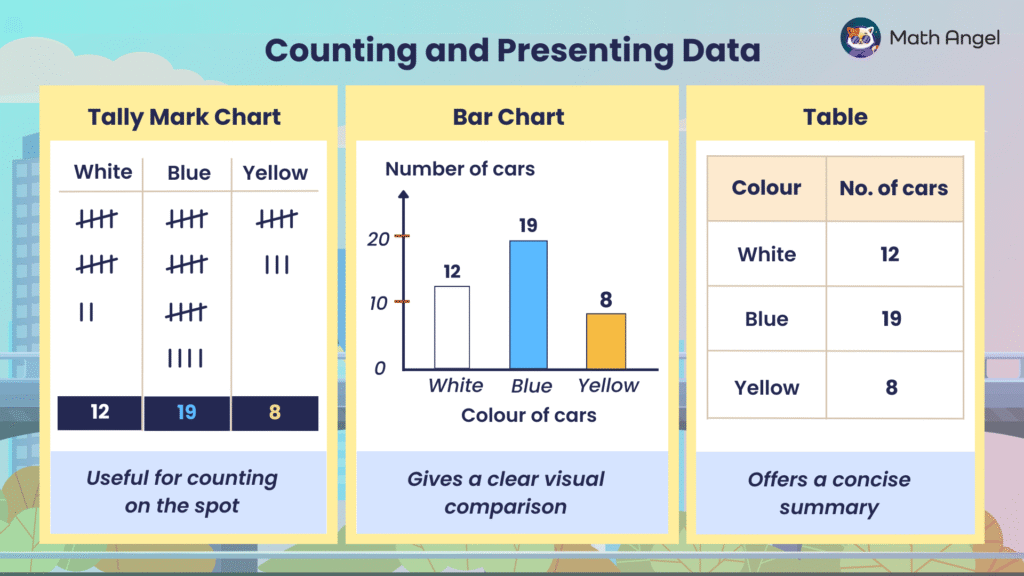
Each method is useful for organising and presenting data. Here’s when to use each:
- Tally Marks
- A simple way to count and record data quickly.
- Uses groups of five for easy visualisation.
- Best for: Counting items in real-time, like surveys or quick observations.
- Bar Charts
- Uses bars to show comparisons between categories visually.
- Quickly highlights differences in values.
- Best for: Comparing different groups clearly, like sales, populations, etc.
- Tables
- Organises data into rows and columns for a structured summary.
- Makes it easy to compare numbers directly while taking up minimal space.
- Best for: Presenting precise numerical data in reports.
🍪 Quiz: Test Your Skills with Data Presentation
Membership Required
You must be a member of Math Angel Plus or Math Angel Unlimited to view this content.
🎩 Stuck on Tally Marks? Try AI Math Solver
Need math help? Chat with our AI Math Solver at the bottom right — available 24/7 for instant answers.