Probability Tree Diagrams
Table Of Contents
🎬 Math Angel Video: Probability Tree Diagram Explained
What is a Probability Tree Diagram?
⏩️
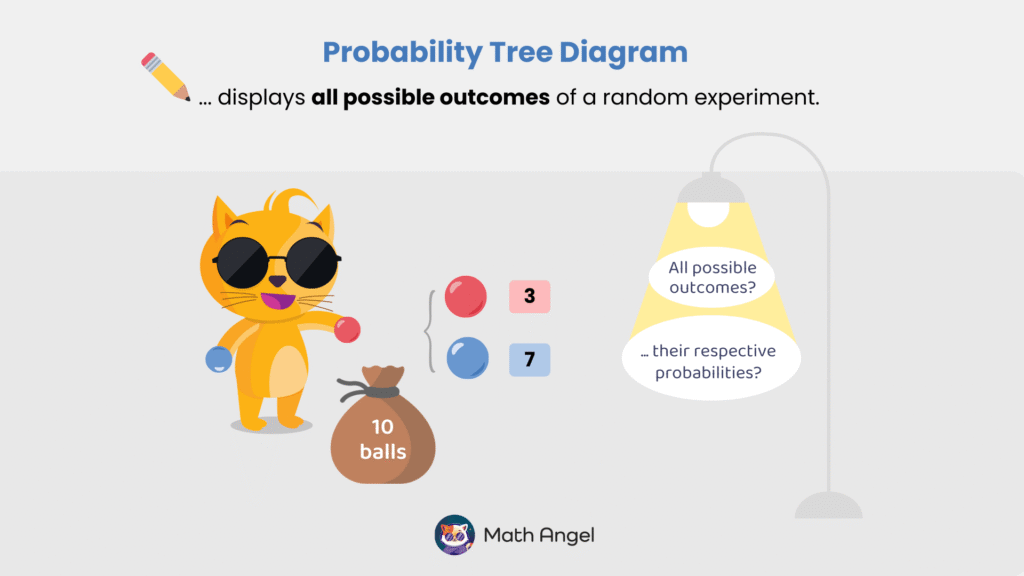
A Probability Tree Diagram is a visual tool used to represent different possible outcomes of an event and their probabilities.
It helps break down complex probability problems step by step.
Probability tree diagrams are especially useful for multi-step events, like drawing balls from a bag one after another or flipping a coin twice.
How to Draw a Probability Tree Diagram?
⏩️
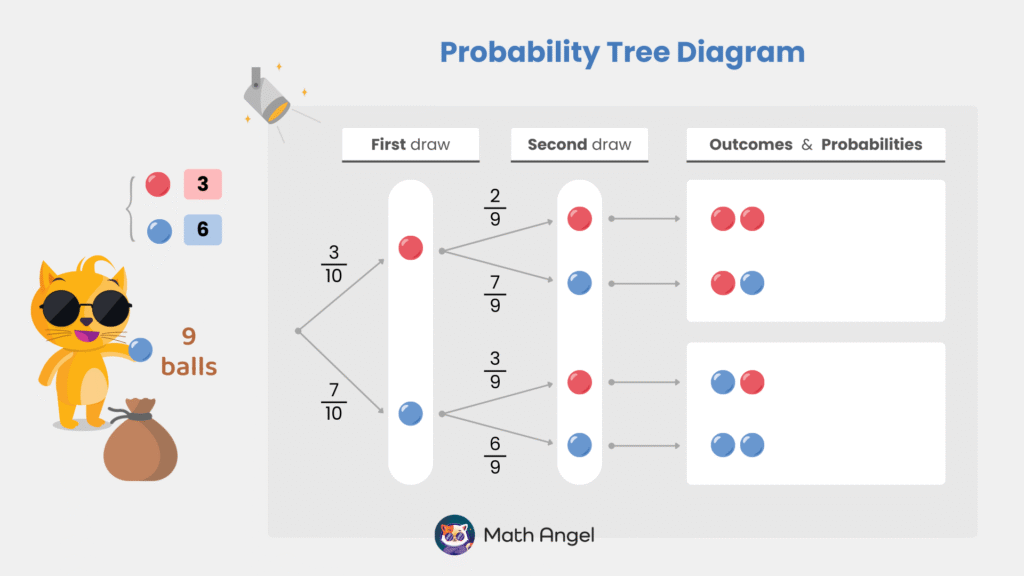
There are 10 balls in total: 3 red balls, 7 blue balls.
🛎️ For the first draw:
- Probability of drawing a red ball: $ \Large \frac{3}{10} $
- Probability of drawing a blue ball: $ \Large \frac{7}{10} $
🛎️ For the second draw, the probabilities depend on what was picked first:
- If the first ball was red (now 2 red and 7 blue remain):
- Probability of drawing another red: $ \Large \frac{2}{9} $
- Probability of drawing a blue: $ \Large \frac{7}{9} $
- If the first ball was blue (now 3 red and 6 blue remain):
- Probability of drawing a red: $ \Large \frac{3}{9} $
- Probability of drawing another blue: $ \Large \frac{6}{9} $
Calculating Probabilities Using a Tree Diagram
⏩️
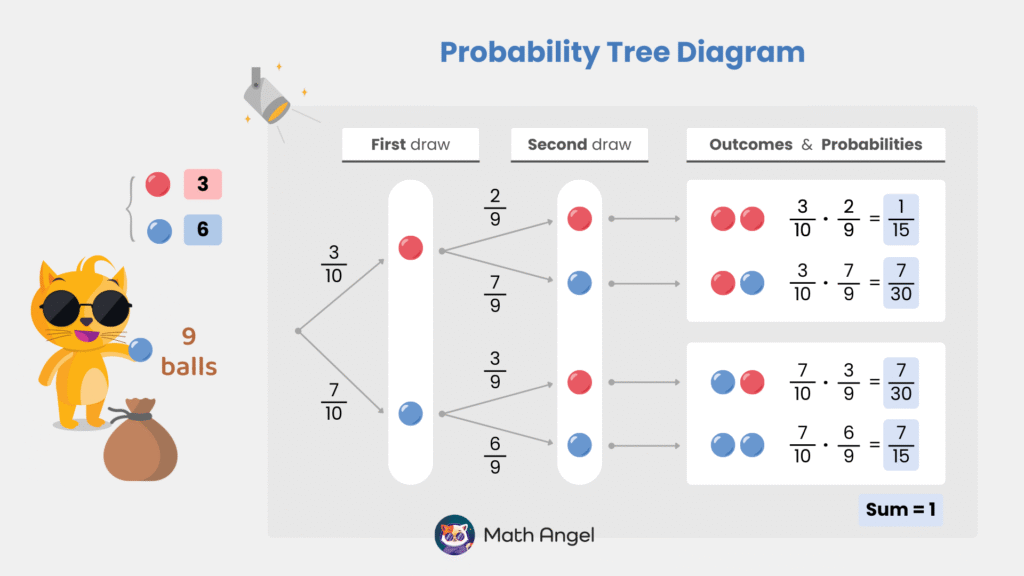
To find the probability of each outcome, multiply along each branch of the tree:
- Two red balls
$$ \frac{3}{10} \times \frac{2}{9} = \frac{1}{15} $$ - First red, then blue
$$ \frac{3}{10} \times \frac{7}{9} = \frac{7}{30} $$ - First blue, then red
$$ \frac{7}{10} \times \frac{3}{9} = \frac{7}{30} $$ - Two blue balls
$$ \frac{7}{10} \times \frac{6}{9} = \frac{7}{15} $$
🛎 Final Check:
Since all possible outcomes are listed, their probabilities should sum to 1.
$$ \frac{1}{15} + \frac{7}{30} + \frac{7}{30} + \frac{7}{15} = 1 $$
Finding the Probability (Example 1)
⏩️
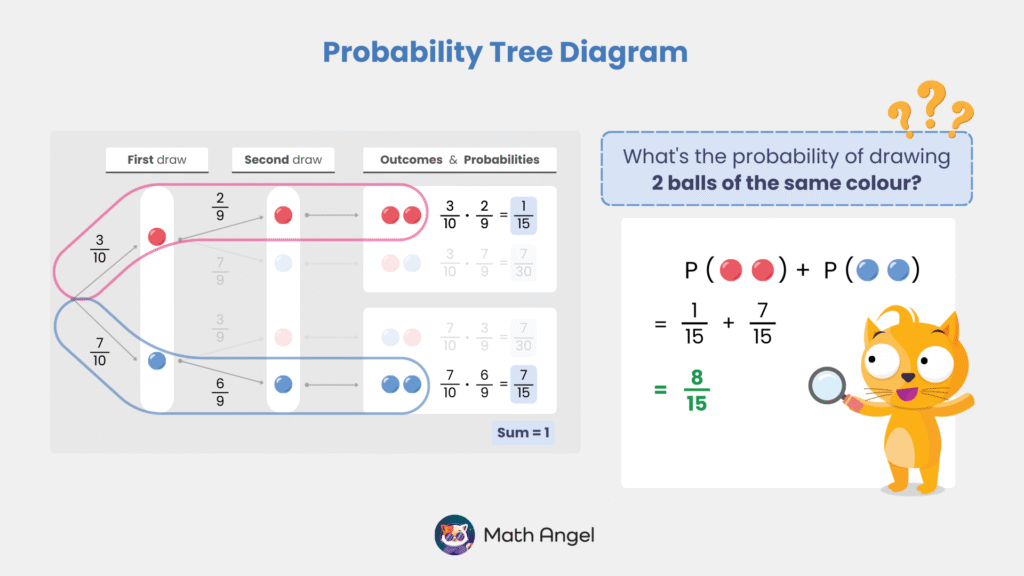
🛎 Find the Probability of Drawing Two Balls of the Same Colour:
To work out this probability, add the probabilities of both red-red and blue-blue outcomes.
- Probability of drawing two red balls
$$ P(\text{🔴🔴}) = \frac{1}{15} $$ - Probability of drawing two blue balls
$$ P(\text{🔵🔵}) = \frac{7}{15} $$
Now, add both probabilities together:
$$ P(\text{🔴🔴}) + P(\text{🔵🔵}) = \frac{1}{15} + \frac{7}{15} $$
Thus, the probability of drawing two balls of the same colour is $\Large \frac{8}{15}$.
Finding the Probability (Example 2)
⏩️
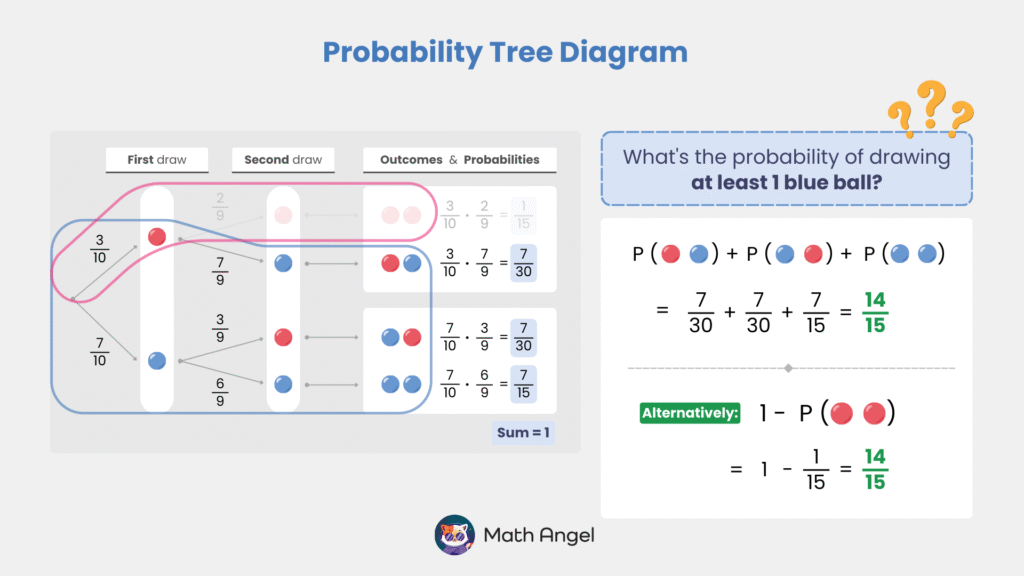
🛎 Find the Probability of Drawing At Least One Blue Ball:
To work out this probability, we can add up the cases:
$$ P(\text{🔴🔵}) + P(\text{🔵🔴}) + P(\text{🔵🔵}) = \frac{7}{30} + \frac{7}{30} + \frac{7}{15} $$
Alternatively, we can use the complement rule. The only unwanted outcome is drawing two red balls: $$ P(\text{🔴🔴}) = \frac{1}{15} $$
Since the total probability is always 1, we subtract the unwanted outcome:
$$ 1 – P(\text{🔴🔴}) = 1 – \frac{1}{15} $$
Thus, the probability of drawing at least one blue ball is: $ \Large \frac{14}{15} $
This method is much faster than adding up all the cases separately! 🚀
🍪 Quiz: Test Your Skills with Probability Tree Diagrams
Membership Required
You must be a member of Math Angel Plus or Math Angel Unlimited to view this content.
🎩 Struggling with Probability? Try Our AI Math Solver
Need math help? Chat with our AI Math Solver at the bottom right — available 24/7 for instant answers.