Displaying {results_count} results of {results_count_total}
Median, Mean, Mode, Range from a Frequency Table
Table Of Contents
🎬 Math Angel Video: Averages from a Frequency Table
What are Mean, Median, Mode, and Range?
⏩️ (0:01)
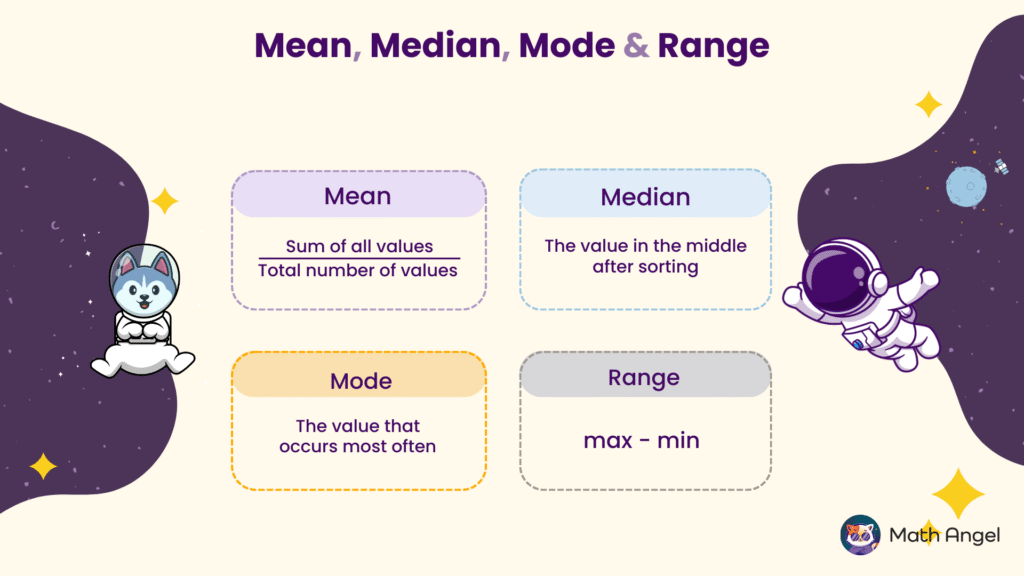
Mean is found by dividing the sum of all values by the total number of values. $$ \text{Mean} = \frac{\sum \text{values}}{\text{Total number of values}} $$
Median is the middle value when all numbers are arranged in order.
Mode is the value that appears most frequently in the dataset.
Range is the difference between the maximum and minimum values.
How to Find the Mean from a Frequency Table?
⏩️ (0:50)
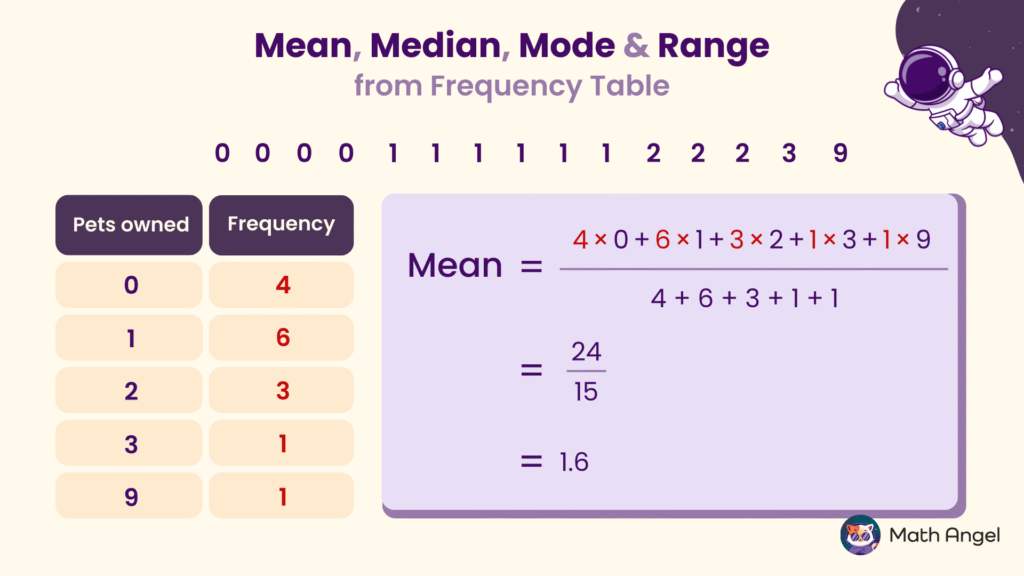
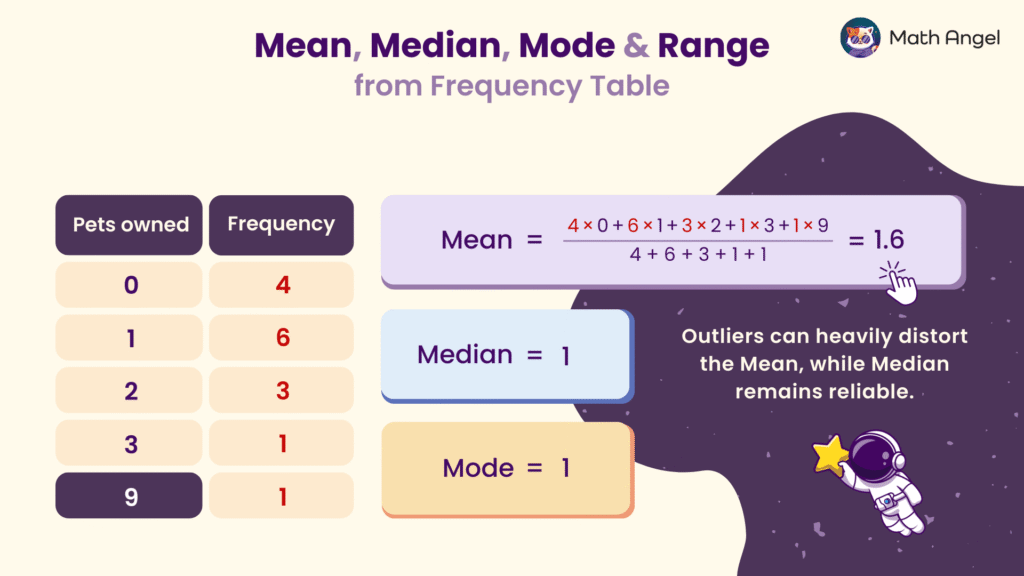
Step 1:Multiply each value by its corresponding frequency and sum these products: $$(4 \times0) + (6 \times 1) + (3 \times 2) + (1 \times 3) + (1 \times 9) = 24$$
Step 2: Calculate the total frequency: $$4 + 6 + 3 + 1 + 1 = 15$$
Step 3:Divide the sum of products by the total frequency: $$24 \div 15 = 1.6$$
How to Find the Median from a Frequency Table?
⏩️ (1:27)
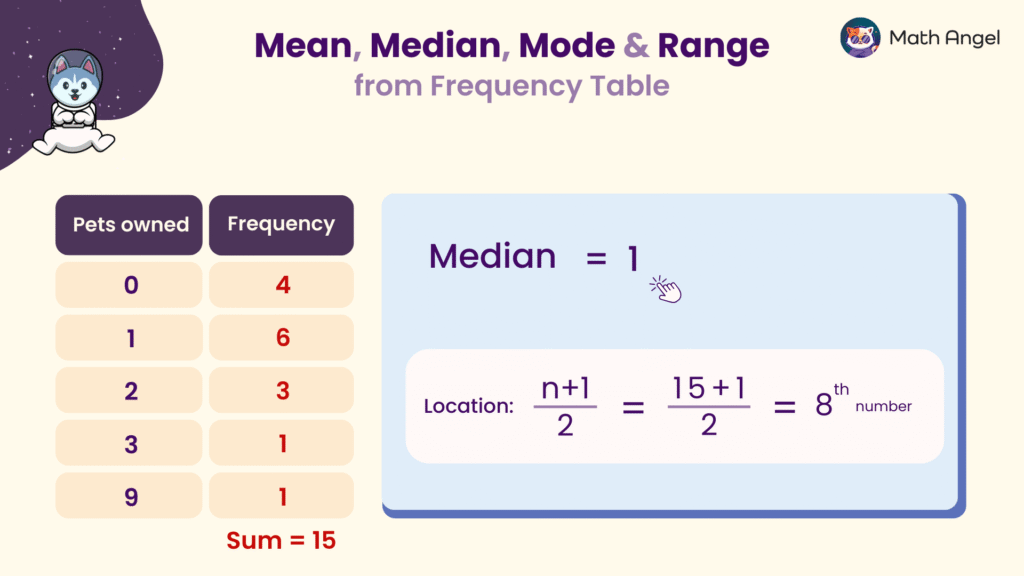
🛎 The formula to determine the position of the median in an ordered dataset is:
$$\frac{n + 1}{2}$$
For example, if the total frequency $n$ is 15, then: $$\frac{15 + 1}{2} = 8$$
This means the median is the 8th value in the ordered list. Based on the frequency table, the 8th value is 1, so the median is 1.
How to Find the Mode and Range from a Frequency Table?
⏩️ (2:27)
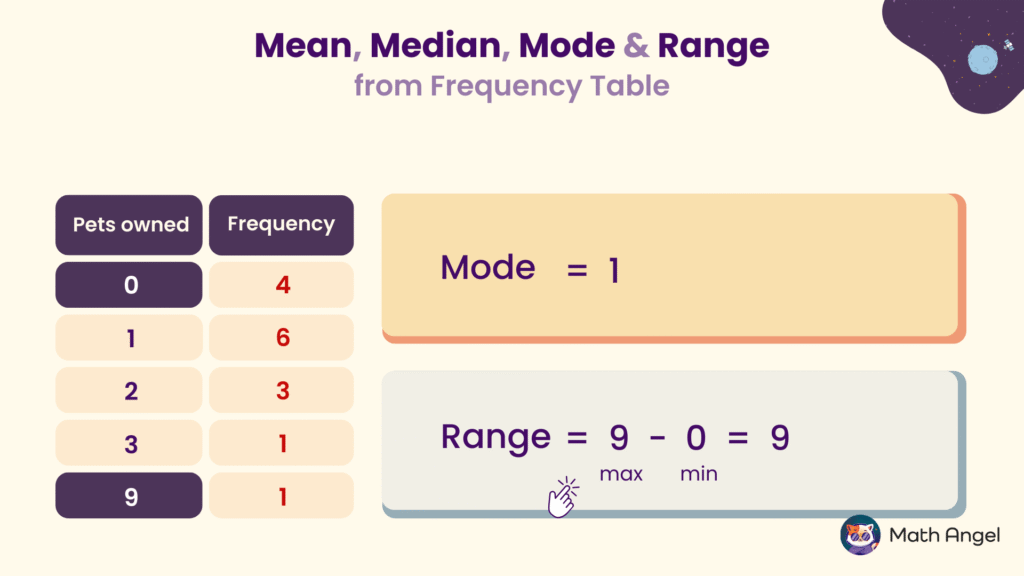
The mode is the value that appears most frequently. In this frequency table, the number 1 has the highest frequency of 6, so the mode is 1.
The range is found by subtracting the smallest value from the largest value. Here, the maximum value is 9, and the minimum value is 0, so the range is 9.
What's the Effect of Outliers on Mean vs. Median?
⏩️ (2:53)
🛎 What is an Outlier?
An outlier is a value that is much higher or lower than the rest of the data.
🛎 How Does Outlier Impact the Mean?
The mean is affected by outliers because it includes all values in the calculation.
A very high or low number can pull the mean up or down, making it less representative.
🛎 How Does Outlier Impact the Median?
The median is more stable because it depends only on the middle value.
Even if there is an outlier, the median stays close to the true center of the dataset.
🍪 Quiz: Test Your Skills on Frequency Tables
Membership Required
You must be a member of Math Angel Plus or Math Angel Unlimited to view this content.