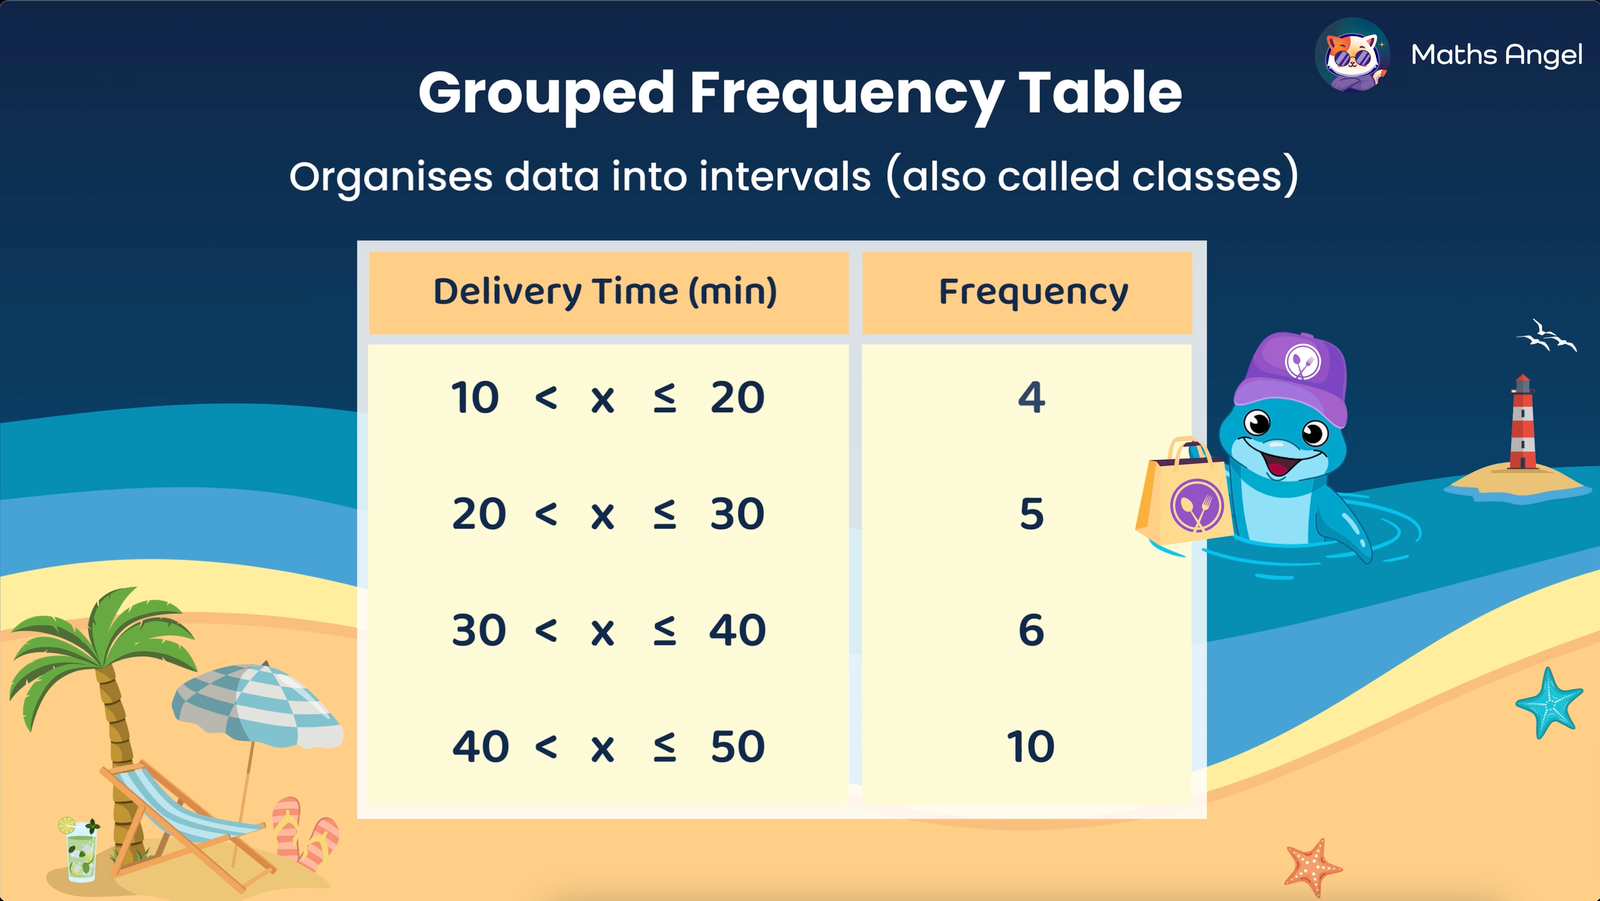
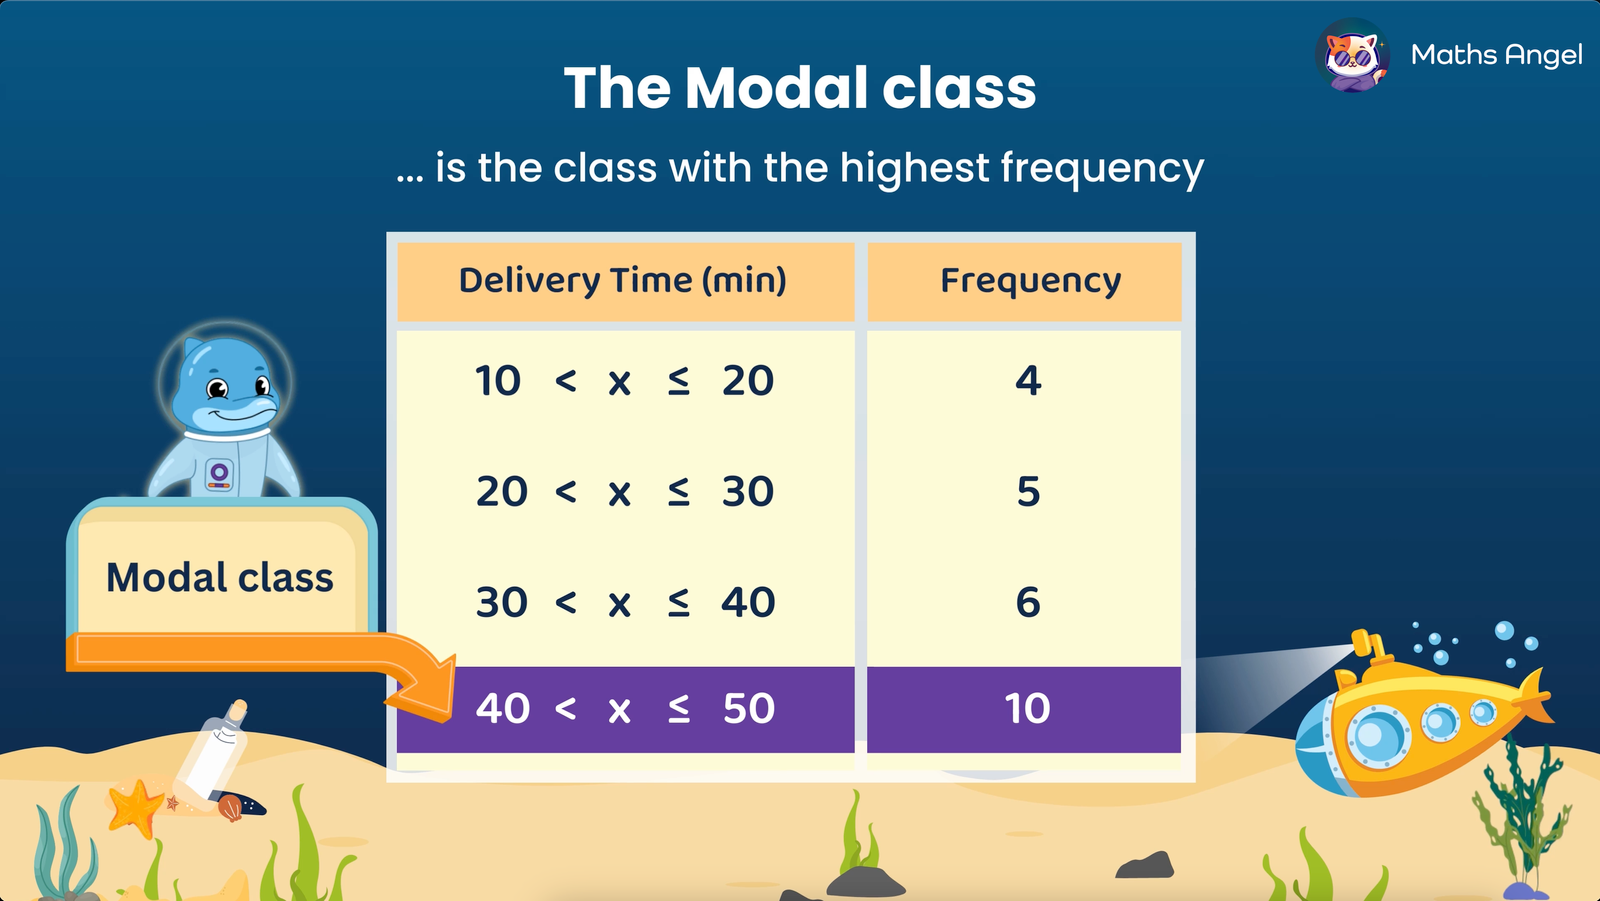
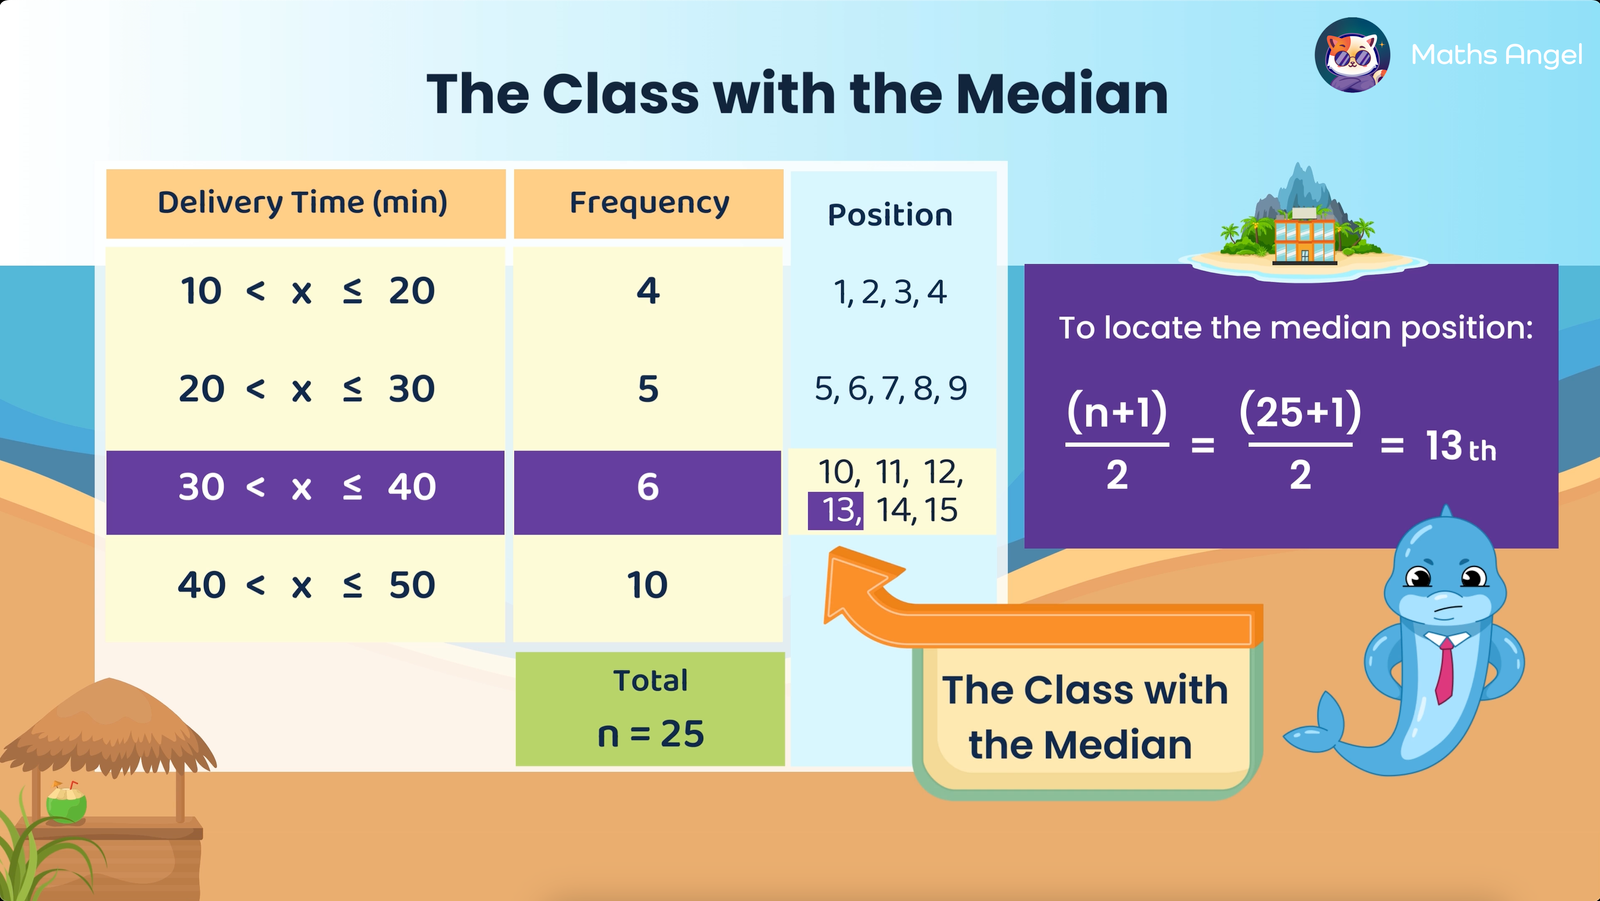
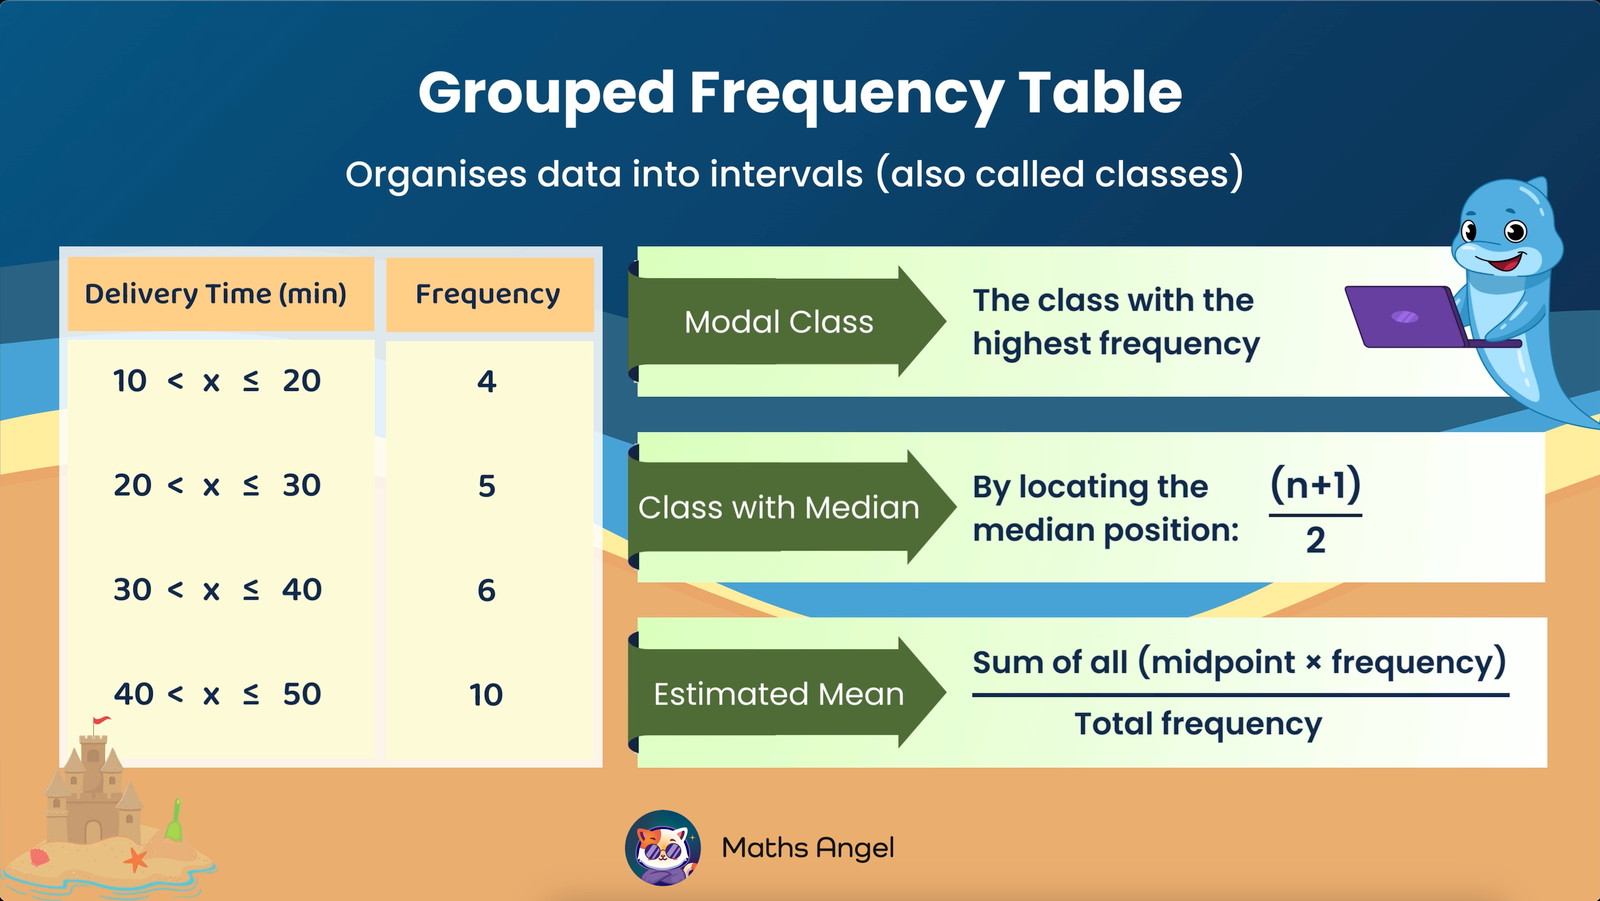
Feedback: Not quite! First, find the total frequency: 4 + 7 + 6 + 3 = 20 people. Since the total is even, the median lies between the 10th and 11th values. The first 4 people fall in the 10–20 minute class, and the next 7 (5th to 11th) are in the 20–30 minute class. That means both the 10th and 11th values fall in the 20–30 minute class, so this class contains the median delivery time.
Feedback: Well done! First, find the total frequency: 4 + 7 + 6 + 3 = 20 people. Since the total is even, the median lies between the 10th and 11th values. The first 4 people fall in the 10–20 minute class, and the next 7 (5th to 11th) are in the 20–30 minute class. That means both the 10th and 11th values fall in the 20–30 minute class, so this class contains the median delivery time.