How to Draw and Read a Box Plot
Table Of Contents
🎬 Math Angel Video: Box Plot Explained with Q1, Q3
What Is a Box Plot?
⏩️
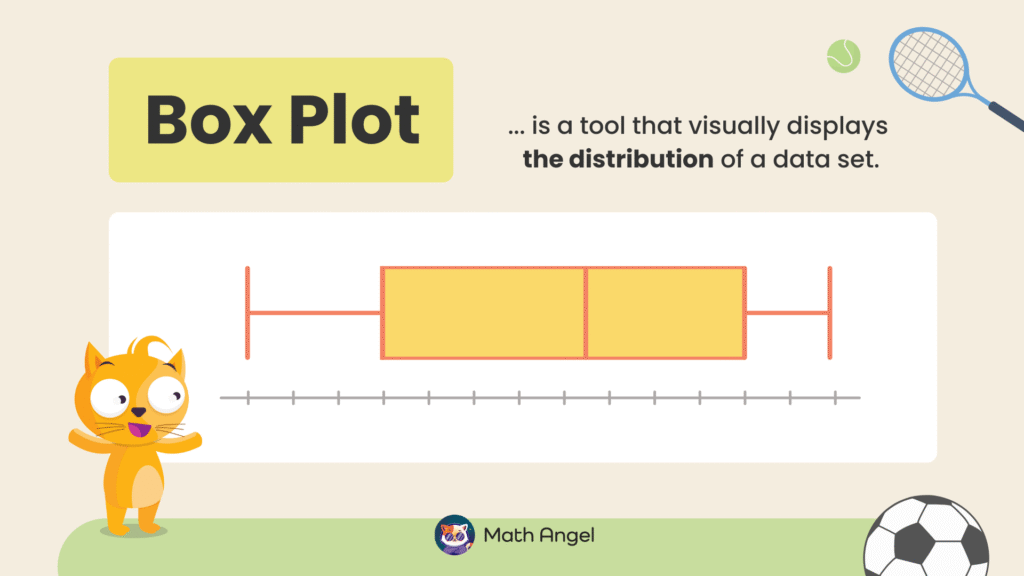
A box plot (or box-and-whisker plot) is a visual tool used to show the distribution of a set of data.
It helps you quickly see how the values are spread out, where the middle lies, and how much the data varies.
🛎️ What Does a Box Plot Show?
A box plot shows five key values in order from lowest to highest:
- The lowest value
- The lower quartile (Q1)
- The median
- The upper quartile (Q3)
- The highest value
🛎️ When Should You Use a Box Plot?
A box plot is especially useful when comparing two or more data sets, because you can quickly see differences in their medians, spreads, and outliers.
How to Draw a Box Plot Step by Step?
⏩️
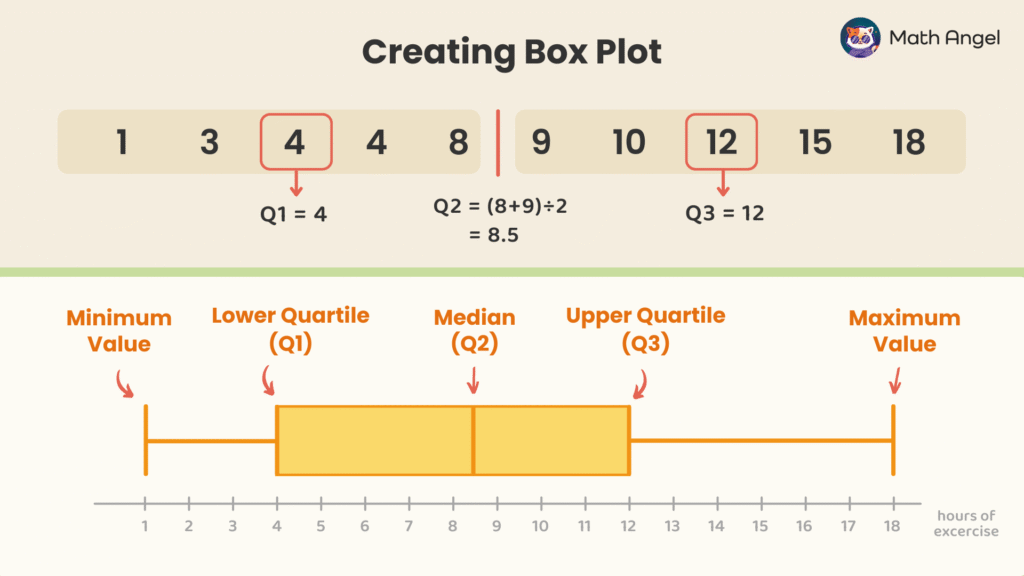
Here are the weekly exercise hours for 10 students:
$$1,\ 18,\ 3,\ 4,\ 12,\ 4,\ 15,\ 8,\ 9,\ 10$$
- Step 1: Sort the numbers from smallest to largest
$$1,\ 3,\ 4,\ 4,\ 8,\ 9,\ 10,\ 12,\ 15,\ 18$$
- Step 2: Find the five key values
- Minimum = 1
- Lower Quartile (Q1) = The median of the lower half (first 5 numbers): $$1,\ 3,\ 4,\ 4,\ 8 \ \Rightarrow\ \text{Q1} = 4$$
- Median (Q2) = The number in the middle of the 10 numbers. Here, Q2 is between the 5th and 6th values, so we can take their average: $$ \frac{8 + 9}{2} = 8.5 \Rightarrow \text{Q2} = 8.5 $$
- Upper Quartile (Q3) = The median of the upper half (last 5 numbers): $$ 9,\ 10,\ 12,\ 15,\ 18 \Rightarrow \text{Q3} = 12 $$
- Maximum = 18
- Step 3: Draw the box plot
- Draw a number line with equal spacing that covers the full range of the 5 values.
- Draw vertical lines at each key value and connect Q1 to Q3 to form the box.
- Add whiskers from the box out to the minimum and maximum.
What are Range and Interquartile Range?
⏩️
A box plot helps us understand how data is spread out. Two important measures are the range and the interquartile range (IQR).
🛎️ What is the Range?
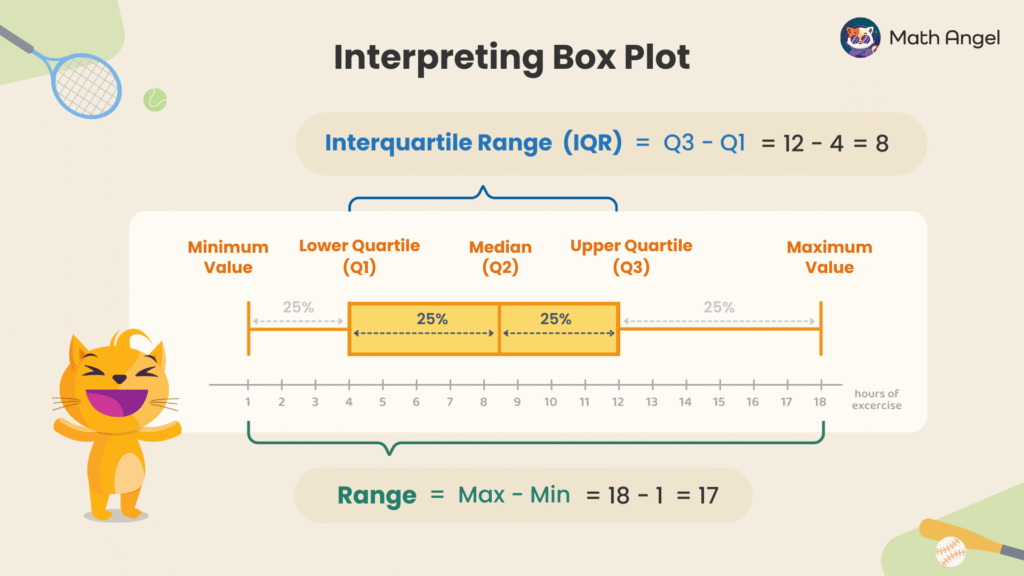
The range is the difference between the highest and lowest values in the data.
In this example:
$$ \text{Range} = \text{Maximum} \ – \ \text{Minimum} = 18 \ – \ 1 = 17$$
- A high range means the data values are spread out widely.
- A low range means the data values are more closely grouped.
🛎️ What is the Interquartile Range (IQR)?
A box plot divides data into four equal parts:
- 25% between the minimum and Q1
- 25% between Q1 and the median (Q2)
- 25% between the median and Q3
- 25% between Q3 and the maximum
The IQR shows the spread of the middle 50% of the data. It is the difference between the upper quartile (Q3) and the lower quartile (Q1).
In this example:
$$ \text{IQR} = Q3 \ – \ Q1 = 12 \ – \ 4 = 8$$
🛎️ What’s the Difference Between Range and IQR?
Range tells us how spread out the entire data set is, from the smallest to the largest number. But range can be affected by extreme values (outliers).
IQR tells us how spread out the middle half of the data is (between Q1 and Q3). IQR is not affected by outliers as it focuses on the bulk of the data.
🍪 Quiz (6 Questions): Practice Box Plots and IQR
🎩 Stuck on Reading Box Plots? Try AI Math Solver
Need math help? Chat with our AI Math Solver at the bottom right — available 24/7 for instant answers.