Courses
Courses Overview
Numbers and Decimals
Units and Fractions
Algebra and Graphs
Geometry and Measures
Probability and Statistics
Exam Prep
GCSE Past Papers
IGCSE Past Papers
AI Math Tools
24/7 AI Solver (ChatCat)
Percentage Calculator
Unit Converter
Rounding Calculator
Fractions Calculator
About
About Us
Meet ChatCat
Blog
Contact
Membership
Membership
Membership (Group Plans)
Login
{results_count} Math videos for {phrase}
Displaying
{results_count}
results of
{results_count_total}
Generic filters
Exact matches only
Search in title
Search in content
Search in excerpt
Filter by Lesson Categories
Probability and Statistics
Geometry and Measures
Algebra and Graphs
Units and Fractions
Numbers and Decimals
Probability and Statistics
Probability and Statistics
Go to all courses
{results_count} Math videos for {phrase}
Displaying
{results_count}
results of
{results_count_total}
Generic filters
Exact matches only
Search in title
Search in content
Search in excerpt
Filter by Lesson Categories
Probability and Statistics
Geometry and Measures
Algebra and Graphs
Units and Fractions
Numbers and Decimals
Probability
Grade 10
All
Grade 10
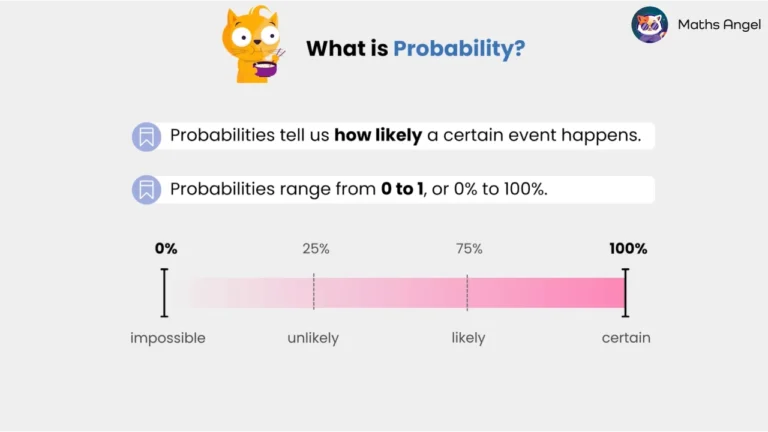
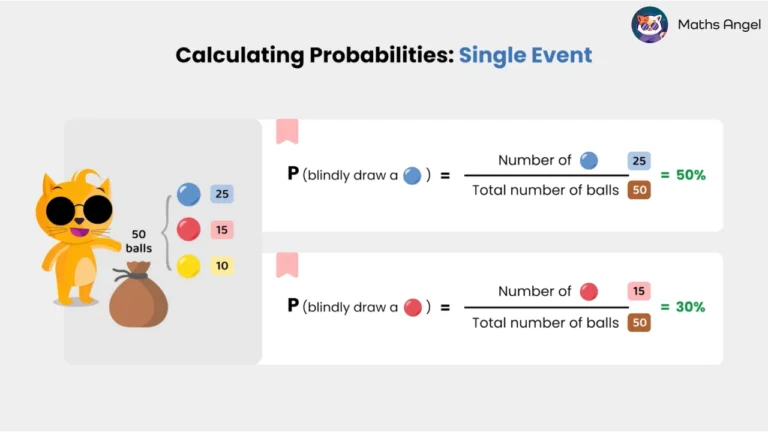
Calculating Probability
Probability measures how likely an event is to happen, from 0 (impossible) to 1 (certain). Learn how…
Grade 10
Addition Rule of Probability and Expected Frequency
For mutually exclusive events, P(A or B) = P(A) + P(B). Learn how to add probabilities and calculate…
Grade 10
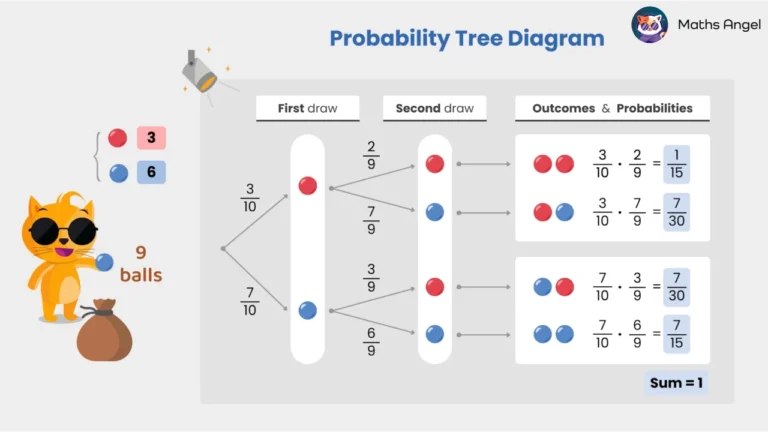
Probability Tree Diagrams
A probability tree diagram is a visual tool to show all possible outcomes of an event and calculate…
Load More
Statistics
Grade 7
Grade 8
All
Grade 7
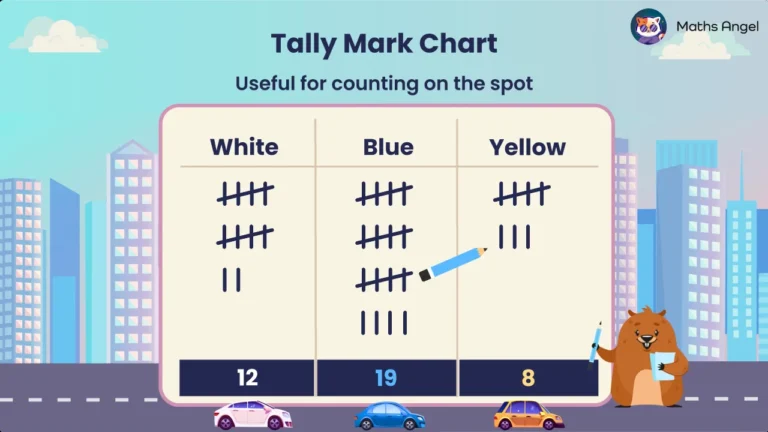
Tally Marks, Bar Charts, Tables
Tally marks count with a bundle of 5 lines. Bar charts compare visually, and tables summarise data c…
Grade 8
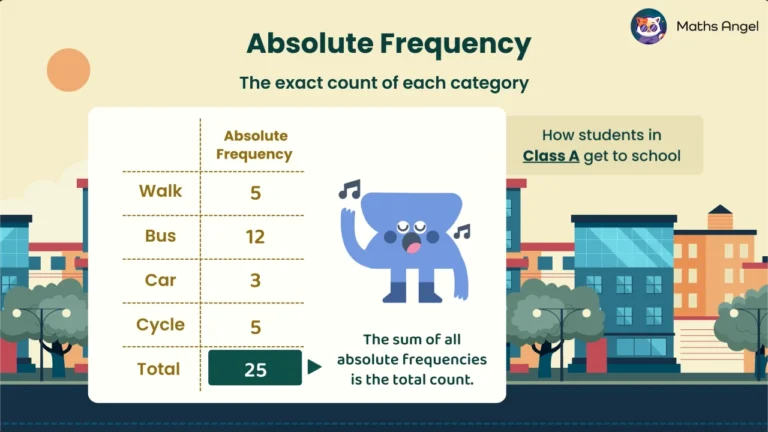
Absolute Frequency and Relative Frequency
Relative frequency is the proportion of a category, calculated by dividing the absolute frequency by…
Grade 8
Pie Chart
A pie chart represents data as slices of a circle, showing proportions within a whole. Learn how to…
Load More
Course Content
Probability
Calculating Probability
Addition Rule of Probability and Expected Frequency
Probability Tree Diagrams
Sets and Venn Diagrams
Statistics
Tally Marks, Bar Charts, Tables
Absolute Frequency and Relative Frequency
Pie Chart
How to Calculate the Mean, Median, Mode, and Range
Median, Mean, Mode, Range from a Frequency Table
Averages from Grouped Frequency Table
How to Draw and Read a Box Plot
Line Graphs and Curve Graphs
All Courses
Numbers and Decimals
Units and Fractions
Algebra and Graphs
Geometry and Measures
Probability and Statistics
Numbers and Decimals
Units and Fractions
Algebra and Graphs
Geometry and Measures
Probability and Statistics
Numbers and Decimals
Units and Fractions
Algebra and Graphs
Geometry and Measures
Probability and Statistics
Numbers and Decimals
Units and Fractions
Algebra and Graphs
Geometry and Measures
Probability and Statistics
Resources
AI Math Solver
Percentage Calculator
Rounding Calculator
GCSE Past Papers
IGCSE Past Paers
AI Math Solver
Percentage Calculator
Rounding Calculator
GCSE Past Papers
IGCSE Past Paers
AI Math Solver
Percentage Calculator
Rounding Calculator
GCSE Past Papers
IGCSE Past Paers
AI Math Solver
Percentage Calculator
Rounding Calculator
GCSE Past Papers
IGCSE Past Paers
About
About Us
Meet ChatCat
Membership
Contact
Blog
About Us
Meet ChatCat
Membership
Contact
Blog
About Us
Meet ChatCat
Membership
Contact
Blog
About Us
Meet ChatCat
Membership
Contact
Blog
Legal
Terms and Conditions
Cookie Policy
Privacy Policy
Terms and Conditions
Cookie Policy
Privacy Policy
Terms and Conditions
Cookie Policy
Privacy Policy
Terms and Conditions
Cookie Policy
Privacy Policy
Instagram
Copyright © 2025
Log In
Username or Email Address
Password
Remember Me
Show Password
Join Now
|
Lost Password?
Login
Accessing this course requires a login. Please enter your credentials below!
Username or Email Address
Password
Remember Me
Lost Your Password?
Register
Don't have an account? Register one!
Register an Account